The Numbers Pediatricians Negotiate Against
How the compensation data shaping pediatric pay is produced, who pays for it, and whose constituency it is designed to serve.
I. The negotiation moment
The number arrives near the end. By the time it does — quoted by a recruiter, offered by a department chair, written into the second paragraph of a letter — you have been in the process for weeks or months. Most pediatricians who reach this point did not get there through an external search firm. They were recruited internally: by a hospital, an academic medical center, a chair who knew their work, an internal recruiter calling on the institution’s behalf.
By the time the figure is named, you have done the pre-screening calls. You have done the site visit. You have eaten dinner with the people who would be your colleagues. You have walked the hallways of the building you are imagining yourself in. You have answered questions about your spouse, your children, your willingness to move. You have begun to picture the life.
Then the number arrives.
It is precise — six digits, sometimes a percentile attached, sometimes a range. It is also the first moment in the process when refusal has a real cost. The cost is not only financial. It is the weeks of conversation, the relationships that have begun to form, the idea of yourself in the role that has settled in over the long pre-decision interval. To say no on the basis of the figure, you would need to know what the figure should have been. You will almost certainly not have that information. You will have only the number you are now being offered.
The negotiation will proceed from the number rather than about it.
This is an article about how the number is made. It is about the surveys, reports, and benchmarks that produce the figures pediatricians cite when they talk about what they are worth. It is about who builds those instruments, who pays for them, and who is named — and not named — among the constituencies they are designed to serve.
II. Doximity: the platform you know
If you have ever tried to find out what your specialty earns, you have probably consulted Doximity. You may have done so already in the recruitment process described above.
Doximity’s annual Physician Compensation Report is the most widely cited “physician-side” salary reference in U.S. medicine. The 2025 edition draws on approximately 230,000 survey responses gathered over six years, including more than 37,000 U.S. physicians in 2024 alone. The company’s own membership materials describe it as the digital network of more than 80% of U.S. physicians. Few sources in the field have a comparable claim to scale.
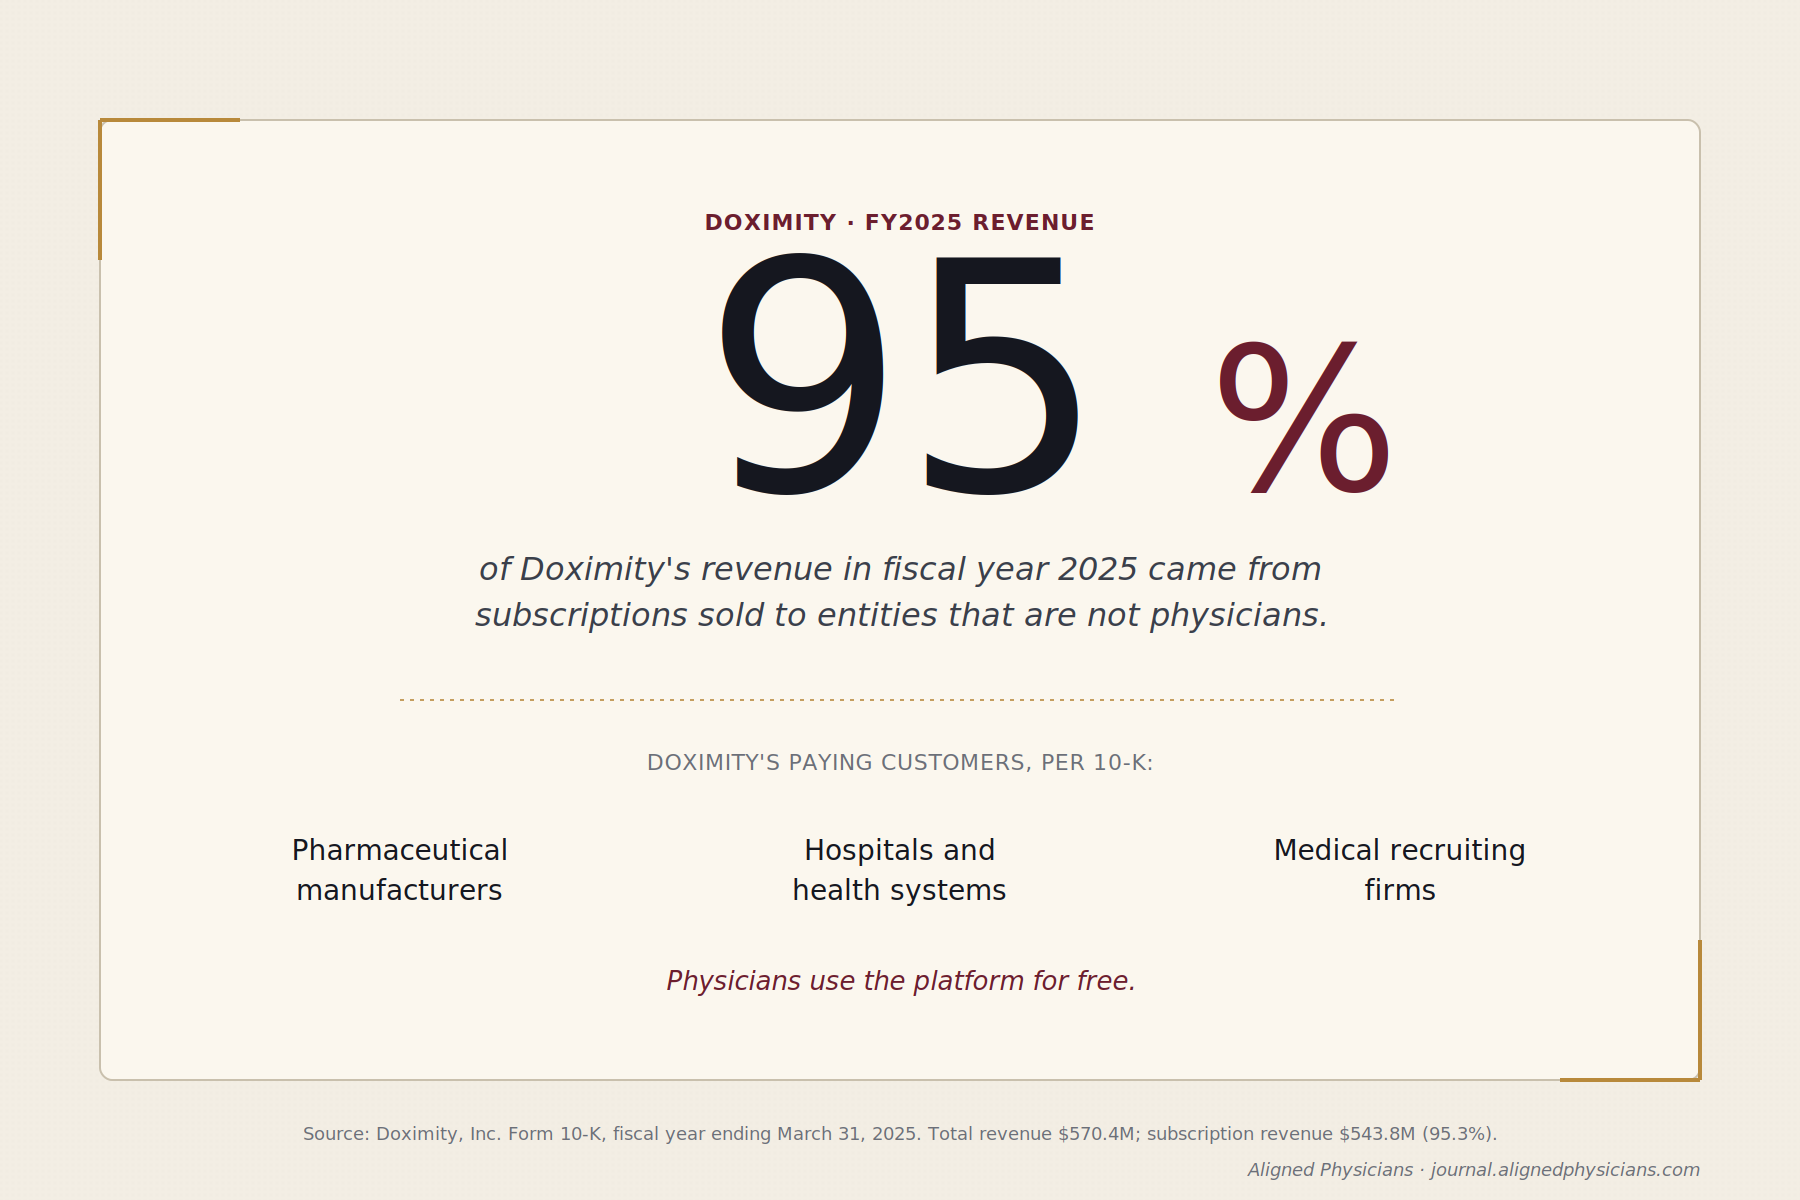
Doximity, Inc. is a publicly traded company, listed on the New York Stock Exchange under the ticker DOCS. For the fiscal year ended March 31, 2025, the company reported total revenue of $570.4 million. The figure is disclosed in the annual report Doximity files with the Securities and Exchange Commission.
The composition of that revenue is what merits attention. Roughly 95% of Doximity’s revenue is subscription revenue — $543.8 million of the $570.4 million reported in fiscal 2025. The subscriptions are not sold to physicians. Doximity’s own 10-K identifies its customer base as “the top pharmaceutical manufacturers, hospitals, and health systems.” The platform’s three product lines — Marketing Solutions, Hiring Solutions, and Workflow Solutions — are subscription products sold to those entities. Pharmaceutical companies pay Doximity to reach physicians with promotional content. Hospitals and health systems pay Doximity to reach physicians with recruiting outreach. Recruiting firms pay Doximity to source candidates for the hospitals and health systems that engage them. The customer is not, in any case, the physician whose compensation the report describes.
The report itself is structured to draw physicians into the platform. Access to the full salary-map feature requires the physician to complete a twelve-question survey of their own compensation. The respondent population is therefore self-selected toward physicians actively researching their market position; the data is self-reported with no independent verification mechanism. The aggregated result — the document hospitals, recruiters, and physicians all cite — is built from those responses.
What this describes, in the company’s own filings, is a content-marketing asset. The compensation report draws physician traffic to a platform whose paying customers are buyers of access to those physicians. The report serves two functions simultaneously: it is the most-cited physician-side salary reference in U.S. medicine, and it is market intelligence sold to the institutions on the other side of the physician labor market. Both functions are openly disclosed.
The structural feature is unusual enough to warrant a sentence stating it directly. The most-cited “physician-side” compensation source in the country is published by a company whose revenue depends on selling access to physicians, to the institutions that employ and recruit them. None of this is hidden. All of it is in the SEC filings.
Whether the report deserves the description “physician-side” — given who pays for the platform that produces it — is a question worth carrying.
If even Doximity sits on this side of the labor market, the question becomes what the other major sources look like.
III. The recruiter-published surveys
The next layer of compensation data sits one step further from physicians, though the surveys are quoted constantly in healthcare media. The most cited of them is the Review of Physician and Advanced Practitioner Recruiting Incentives, published by Merritt Hawkins — now formally branded as AMN Healthcare’s Physician Solutions division, though the original name still appears on the report. The 2025 edition is the 32nd. AMN Healthcare itself is publicly traded on the New York Stock Exchange under the ticker AMN, and is the largest healthcare staffing company in the United States.
The Review’s described audience is not physicians. The publisher describes it, in its own promotional language, as a “standard benchmarking resource used by hospitals, medical groups and other healthcare facilities to determine which incentives are customary and competitive.” The report is built for the parties on the buy side of the physician labor market, and its publisher names them.
Physician recruiting firms operate on two payment structures. The contingency model pays the recruiter a fee equal to twenty to twenty-five percent of the physician’s first-year compensation, paid by the hospital upon successful placement. The retained model pays an upfront fee plus milestone billing, again paid by the hospital. Under either model, the physician pays nothing. The hospital pays everything.
Consider what that fee actually represents. On a $250,000 first-year pediatrician salary, a 20% contingency fee comes to $50,000. The hospital has already budgeted that money — it is part of the cost of acquiring the physician, not a discount the recruiter is offering. If no recruiter were involved, the $50,000 would still exist somewhere in the hospital’s physician-acquisition spend. The question is where it goes.
Now imagine an alternative. Suppose the physician retains their own recruiter — one paid by the physician, on an hourly or pre-negotiated basis, with no contingency on placement. The recruiter works for the physician’s interests in the way the financial-planning world calls fee-only: no commissions from the buy side, no fee structure that depends on a transaction closing. The hospital, no longer paying the placement fee to a recruiter on its own side, has $50,000 it would otherwise have spent. That money does not have to disappear. It can be redirected — most cleanly, to a signing bonus paid to the physician. The physician’s out-of-pocket cost for the independent recruiter is recouped, and the hospital’s total physician-acquisition cost is unchanged.
This is not a hypothetical. It is the logic that the financial-planning industry institutionalized in the broker-to-fiduciary distinction. The Securities and Exchange Commission’s Regulation Best Interest, the Department of Labor’s fiduciary rule debates, and the FINRA disclosure regime all exist because the difference between a professional paid by the client and a professional paid by the counterparty is the difference between two different jobs. Physician recruiting has no analogous regime. The same recruiter calls family medicine physicians on a Tuesday and pediatric subspecialists on a Wednesday, and in both cases is paid by the hospital, never by the physician. There is no disclosure rule. There is no fiduciary line. There is no professional category yet defined.
If you would like to test the structure for yourself, the next time a recruiter contacts you, ask them this: “would you be willing to work for me under contract, paid by me, on the same terms you currently work for the hospital?” I have asked this question, and I know the answer. I do not want to guess the answer you would get. Try this. You would be genuinely surprised.
What kind of professional are you actually talking to when a recruiter reaches you? It is a question worth holding before turning to the surveys hospitals and medical groups consult when the recruiter is not in the room at all.
IV. The industry-standard benchmarks
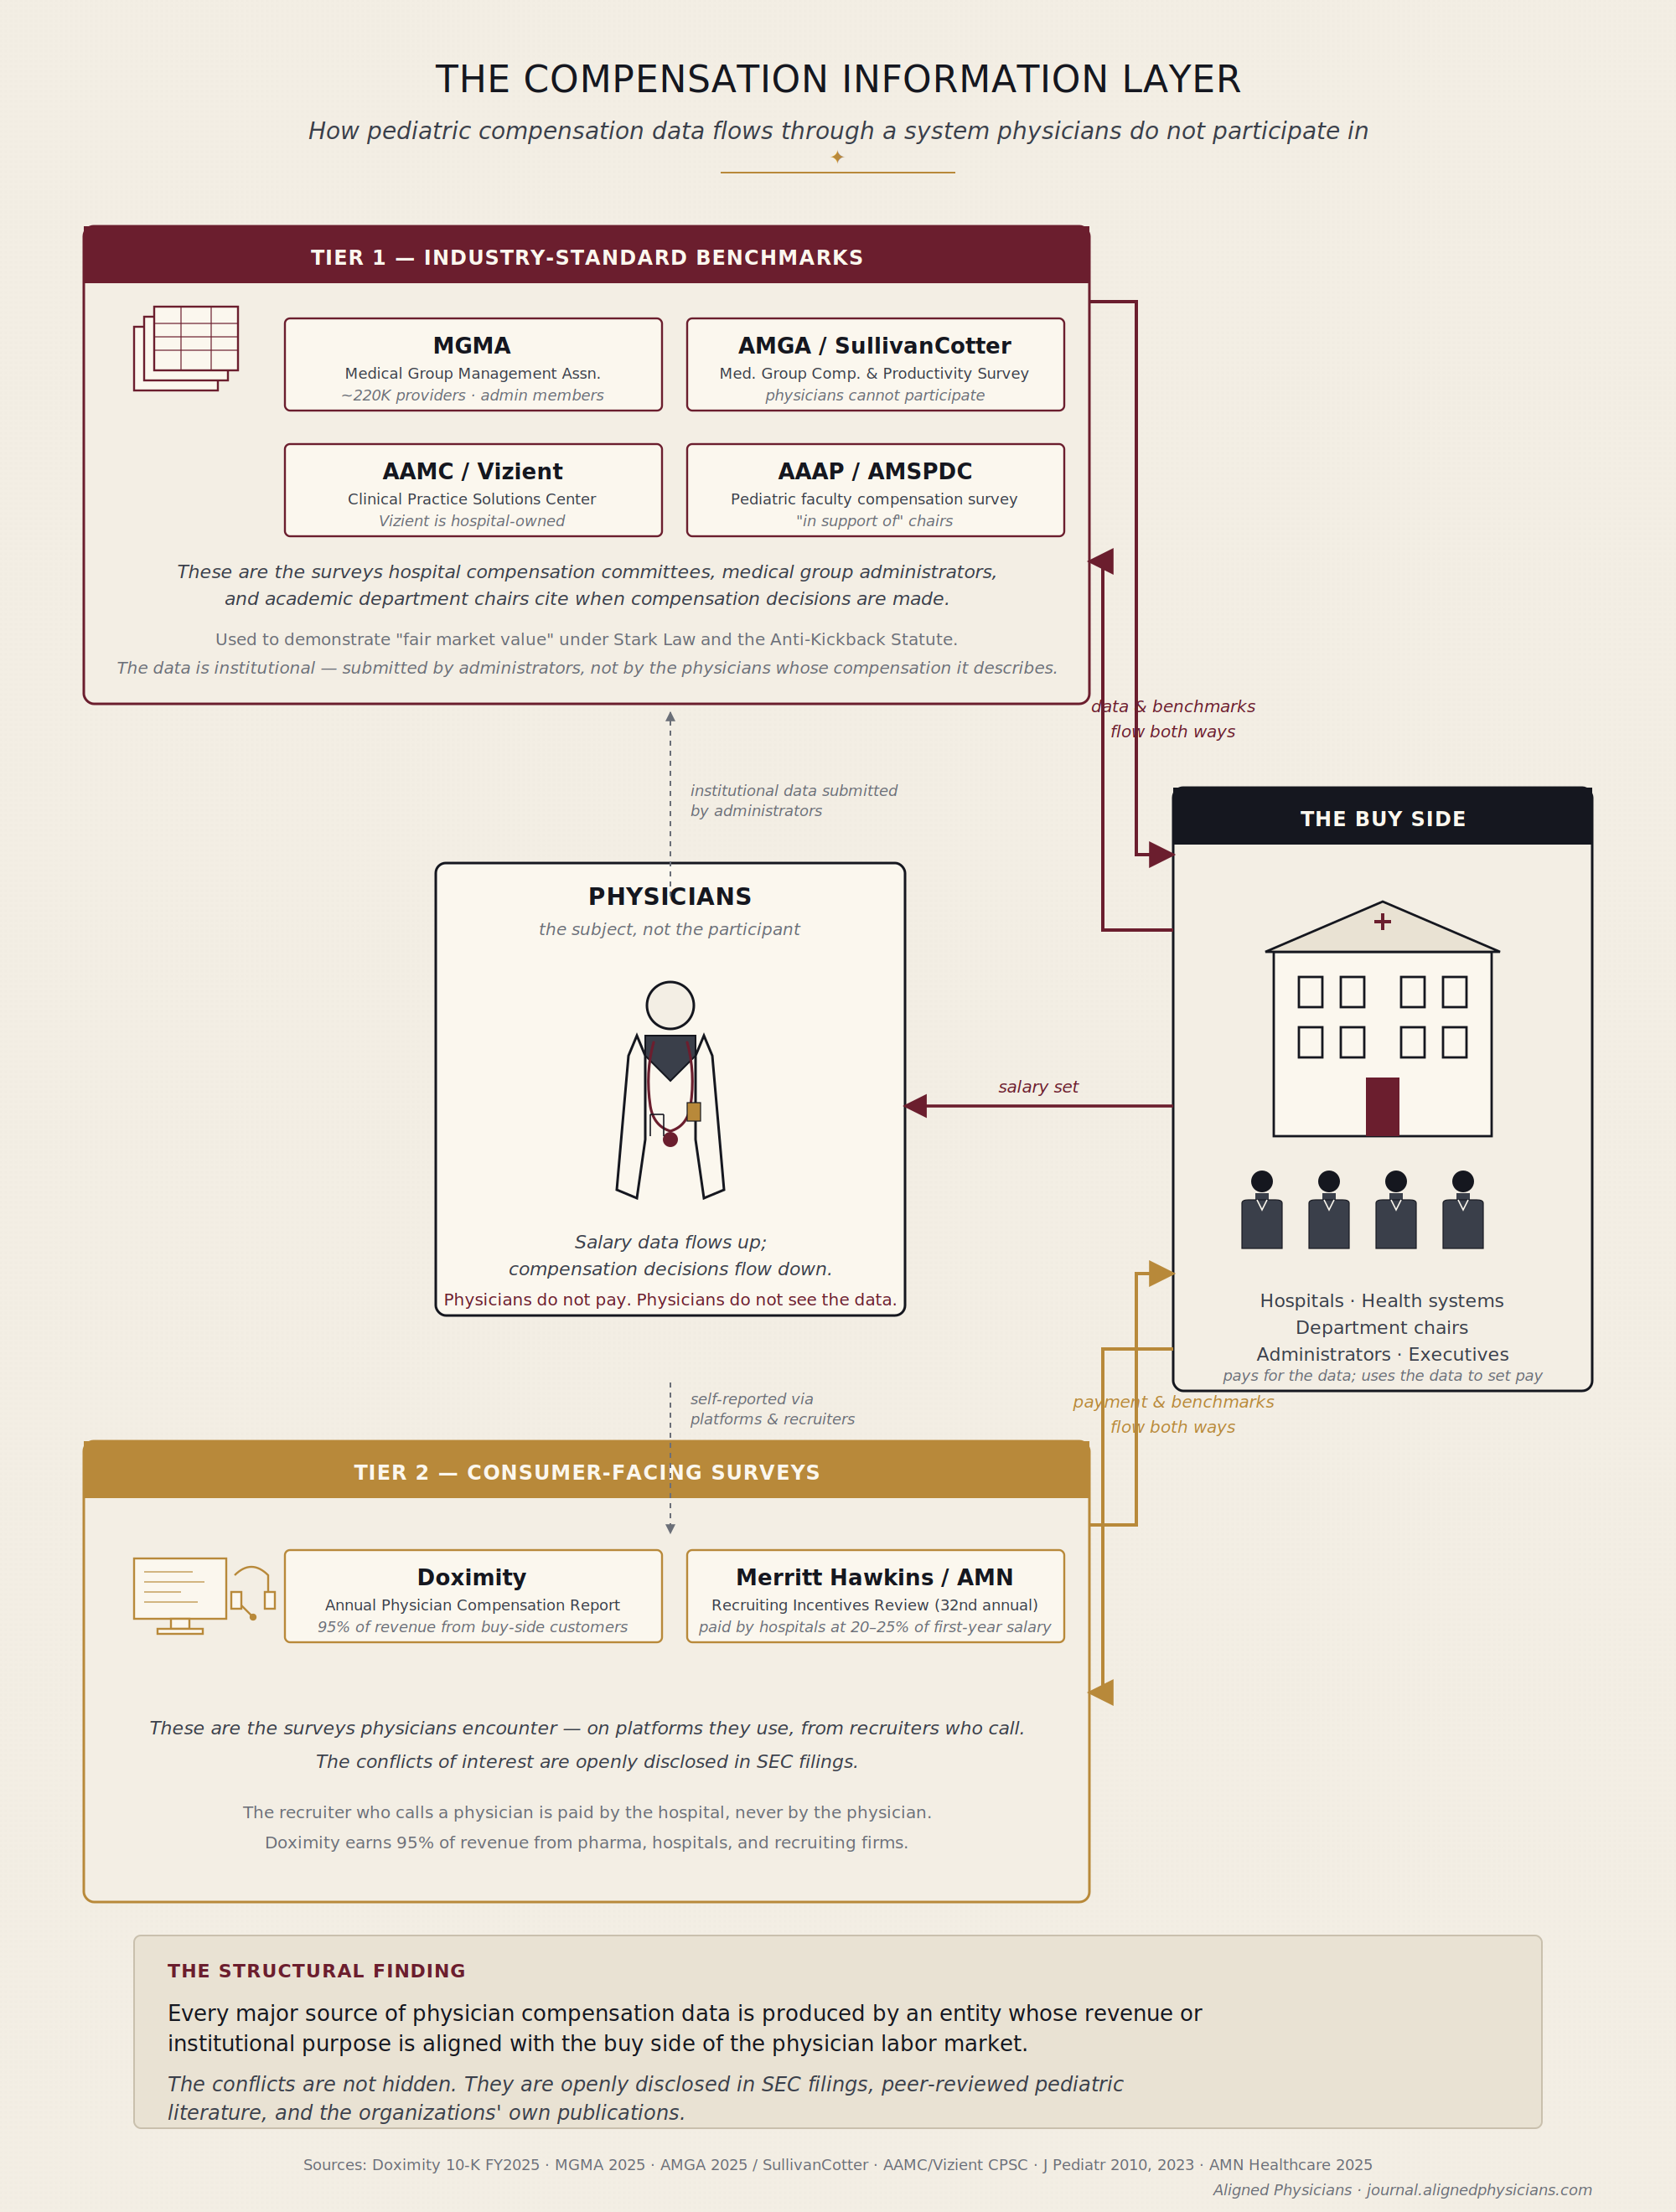
These are the surveys that matter when the contract is signed. They are the ones hospital compensation committees, medical group administrators, and academic department chairs actually cite when they decide what to pay. They are also, with one exception of degree, less visible to physicians than Doximity or Merritt Hawkins — institutionally serious, methodologically detailed, and rarely encountered outside the offices where compensation is set.
The most widely cited of them in private-practice and hospital-employed settings is the Provider Compensation and Productivity Report published by the Medical Group Management Association. MGMA describes itself as a national professional association of health care administrators and practice leaders. Its membership is the people who set physician compensation, not the physicians whose compensation is set. The 2025 edition of its report draws on data from more than 220,000 physicians and advanced practice providers. Member practices submit their compensation and productivity records to MGMA, which aggregates the submissions and returns the report to member practices for use in their own compensation decisions. The print edition is restricted to small-practice owners with six or fewer physicians; larger organizations access the data through the DataDive License, sold to “non-clinical health care provider organizations, medical schools, integrated health care systems, hospitals, and healthcare providers.” The product, in MGMA’s own categorization, is built for the buy side. MGMA’s own product page describes the data set as “a Federally recognized source to assist in fair market value” — language whose significance the next section will return to.
Beyond MGMA, two parallel arrangements anchor the second tier. The American Medical Group Association is, like MGMA, an institutional membership organization, with “more than 400 member health systems and medical groups.” Members are institutions, not physicians. The AMGA Medical Group Compensation and Productivity Survey, in its 38th year, draws on nearly 185,000 providers across 482 medical groups in its 2025 edition. The data is reported only by member organizations, and within those organizations, almost always by administrators rather than physicians. The structural fact that follows from this is worth stating plainly: individual physicians cannot participate in the AMGA survey. The data set that compensation committees cite as “the market” is reported entirely by the buy side. The survey is administered by AMGA Consulting, AMGA’s wholly-owned for-profit subsidiary, whose paying clients are health systems and medical groups — the same institutions that report data to the survey. Per AMGA’s own 2025 survey methodology document: “All responses are sent directly to AMGA Consulting.”
The same architecture repeats itself, in parallel, at SullivanCotter. Historically the AMGA survey’s external administrator, SullivanCotter today publishes its own separate Physician Compensation and Productivity Survey, covering 215,400 providers across 541 organizations. SullivanCotter’s clients are health systems and academic medical centers — again, the same institutions whose physicians the survey describes. Two compensation-consulting firms, each running a large national survey whose data reporters are the firms’ own consulting clients.
For academic physicians, the dominant analytics platform is the Clinical Practice Solutions Center, formerly the Faculty Practice Solutions Center. CPSC is a joint product of two organizations whose collaboration both describe as more than twenty years old: the Association of American Medical Colleges and Vizient, Inc. AAMC is the nonprofit association of U.S. and Canadian medical schools and academic teaching hospitals. Vizient, per its own 2024 Public Accountability Questionnaire, is “a Delaware corporation” and “a private, for-profit company” whose stockholders are “all current and former member institutions, made up of community-based healthcare providers and academic medical centers.” The board of Vizient is composed of executives from those member institutions. The institutions that employ academic physicians, in other words, jointly own the analytics company that produces the comparative compensation data used to set those physicians’ salaries.
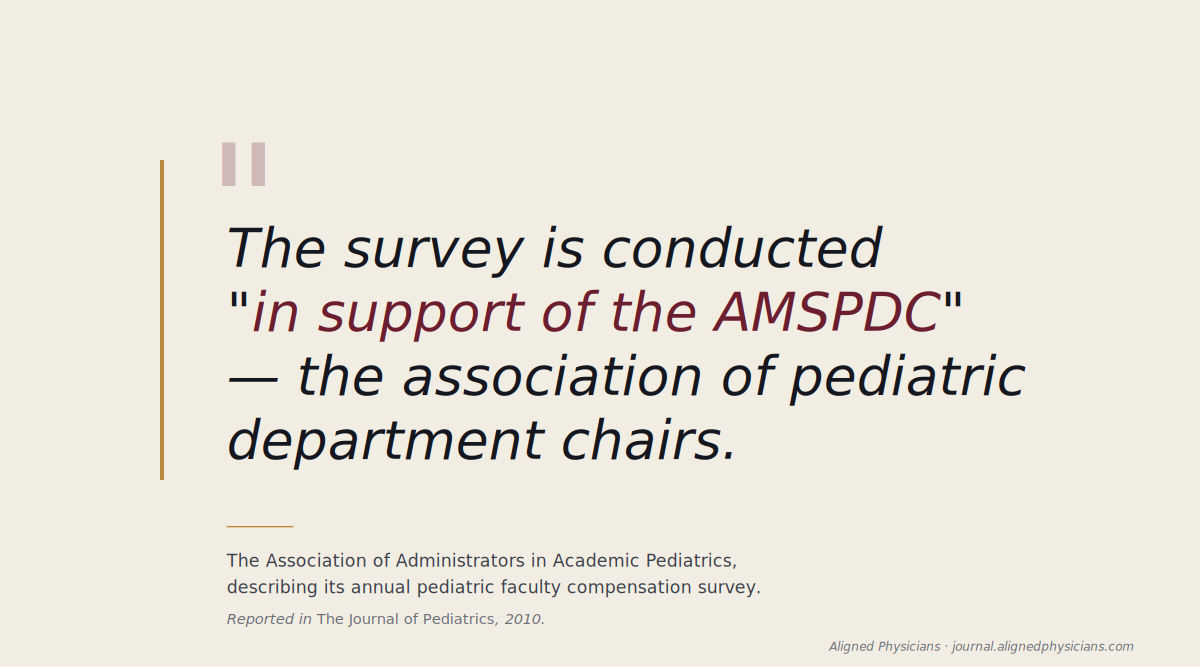
The pediatric-specific architecture is more compact and more revealing. AMSPDC, the Association of Medical School Pediatric Department Chairs, is the national organization of pediatric department chairs at U.S. and Canadian medical schools — roughly 153 member departments. AAAP, the Association of Administrators in Academic Pediatrics, is the parallel organization for the senior administrators who serve as the chairs’ dyad partners. AAAP produces the annual pediatric faculty compensation and productivity survey. The data the survey aggregates is the institutions’ data — the compensation and productivity records that academic medical centers maintain for their pediatric faculty. Administrators submit that data, on the institution’s behalf, to a third-party data collector. AAAP aggregates the submissions and returns the report to participating institutions through a proprietary analytics portal. The faculty whose data is being submitted are not consulted in the process. They are not asked to opt in, and they are typically not informed when their compensation has been included in the dataset that will, in due course, be used to set their compensation. None of the intermediaries in this chain — not the institution’s HR system, not the administrator who submits the data, not the third-party data collector, not the analytics platform, not AAAP, not AMSPDC — sits on the faculty’s side of the negotiation.
The relationship between AAAP and AMSPDC is described, in the Journal of Pediatrics, in language the survey’s own organizers use. A 2010 article on the survey’s clinical-FTE methodology states that the AAAP annually produces its comprehensive pediatric faculty compensation and productivity survey “in support of the AMSPDC.” The faculty whose compensation feeds the dataset are not named — in that sentence or in the survey’s organizational mission — as a constituency the survey is conducted in support of.
Across all four pipelines, the surveys cited as authoritative are produced by entities whose institutional interests sit on the same side of the labor market — the side that purchases physician services. None of them is produced by, conducted by, or institutionally aligned with the physicians whose compensation they describe.
Why might it be that no nationally cited compensation benchmark in U.S. medicine is produced by an organization that names physicians as the constituency it serves? It is a question worth holding before turning to the regulatory architecture that surrounds these surveys.
V. The regulatory architecture
The pattern has a name. It is what the regulatory architecture, taken as a whole, requires.
Under the federal Stark Law and the Anti-Kickback Statute, hospital compensation paid to physicians who refer Medicare or Medicaid patients for designated health services must, under most applicable exceptions and safe harbors, not exceed fair market value. Stark is a strict-liability statute; the Anti-Kickback Statute carries criminal penalties of up to ten years per violation. Documentation is not optional. The Office of Inspector General’s Compliance Program Guidance for Hospitals — first issued in 2005, reiterated and expanded in 2023 — directs hospitals to “have appropriate processes for making and documenting reasonable, consistent, and objective determinations of fair market value.” Hospitals do this through comparable market data. The surveys described in the previous section are the comparables.
This explains the architecture observed previously. The buy side produces the compensation surveys because the buy side is the party legally obligated to produce them. MGMA’s own product page describes its compensation data set, in marketing copy aimed at administrators, as a tool designed to support the regulatory documentation function. The producer of one of the three industry-standard surveys names the function explicitly. The article does not need to argue that the surveys serve this regulatory purpose. The publishers say so themselves.
The structural claim follows directly. The regulatory regime, as currently constructed, requires the buy side to define what the market is. That requirement is the precondition for the captured-information architecture the previous sections have described. The architecture is not the result of bad actors arranging it that way; it is the result of a compliance regime that locates the documentation burden on the side of the market that purchases physician services, and assumes — without saying so — that the side documenting the market is also the side equipped to define it.
Physicians have no equivalent regulatory regime. No statute requires that physician compensation be set at the upper bound of fair market value. No fiduciary duty runs from buyers to the physicians they employ. No agency requires that compensation surveys be jointly produced by representatives of both sides of the labor market. The information the OIG directs hospitals to assemble is, by design, market data the hospital can defend in an audit. Whether that data also represents what physicians are worth is a different question, and one the regulatory regime does not require anyone to answer.
It is worth being precise about what this article is and is not claiming. It is not claiming that the surveys are fraudulent. They are not. It is not claiming that the survey publishers are violating Stark or the Anti-Kickback Statute. They are not — the surveys are the mechanism by which compliance is achieved. It is not claiming that any individual administrator, recruiter, or compensation consultant is acting in bad faith. The architecture works as it does because the people inside it are doing their jobs as the architecture has defined those jobs.
The diagnosis is structural. Captured information is not the same as corrupted information. The compensation data described in the previous sections is not wrong in any sense an audit would catch. It is the answer to a different question than the one physicians think they are asking. When a pediatrician reads a percentile, they think they are reading what their work is worth. They are reading what the buy side has documented as the price at which it is willing to purchase work like theirs. Those two figures are related, but they are not the same figure.
Whether the difference between those two figures matters — and whether the people whose compensation is being measured ought to have a means of producing the second figure for themselves — is the question this article ends on.
VI. The framing question
The architecture is now visible. None of it is hidden. None of it required investigative work to uncover; every fact the previous sections describe is openly disclosed in SEC filings, organizational charters, journal articles, and the survey publishers’ own marketing copy. What was missing was a way of looking at the whole structure at once, rather than at any one of its parts.
This article does not propose what to do about it. The remedies — what physicians might build, what data they might collect for themselves, what disclosures they might begin to require — are the subject of articles to follow. The diagnostic article is not the prescriptive one, and the discipline of separating the two is part of what the journal exists to model.
What this article does deliver is one practical consequence. The next time a pediatrician encounters a compensation figure — a percentile in a salary map, a number in an offer letter, a benchmark cited by a department chair — there is a question available that was not available before. The question is not technical. It does not require legal training, financial expertise, or institutional access. It requires only the willingness to ask it.
The question is this:
Who paid for the number you are about to negotiate against?
The answer, in every case the previous five sections have described, is the same. The number was paid for by an entity whose institutional interests sit on the side of the labor market that purchases physician services. The number was produced by a survey, a report, or an analytics platform whose customers, members, or shareholders are the buyers. The data underneath the number was, in many cases, taken from the records of the institution that employs the physician — submitted by an administrator with access to those records to a third-party collector who passed it to the publisher whose product the institution then purchased. The physician whose compensation is the data was not consulted, not notified, and in many cases never told which survey was being cited when the number was returned to them in a meeting.
I have lived the experience of asking. In a discussion where my productivity percentile was being cited as the basis for compensation, I asked which survey it had come from. I was met with silence. I asked again. After some time, I was told it was from the AAAP. I asked about the methodology, about how the dataset’s productivity definitions applied to my clinical environment, about how to read the percentile in light of the case mix in my practice. I was met with silence again. The architecture this article describes is not theoretical. It is the silence on the other side of the question.
The number is not wrong. It is the answer to its own question. It is just not the answer to the question the pediatrician thinks they are asking.
Beginning to ask the question is what this article is for.
Satyanarayan Hegde, MD, is a pediatric pulmonologist and the founder of Access Pediatric.